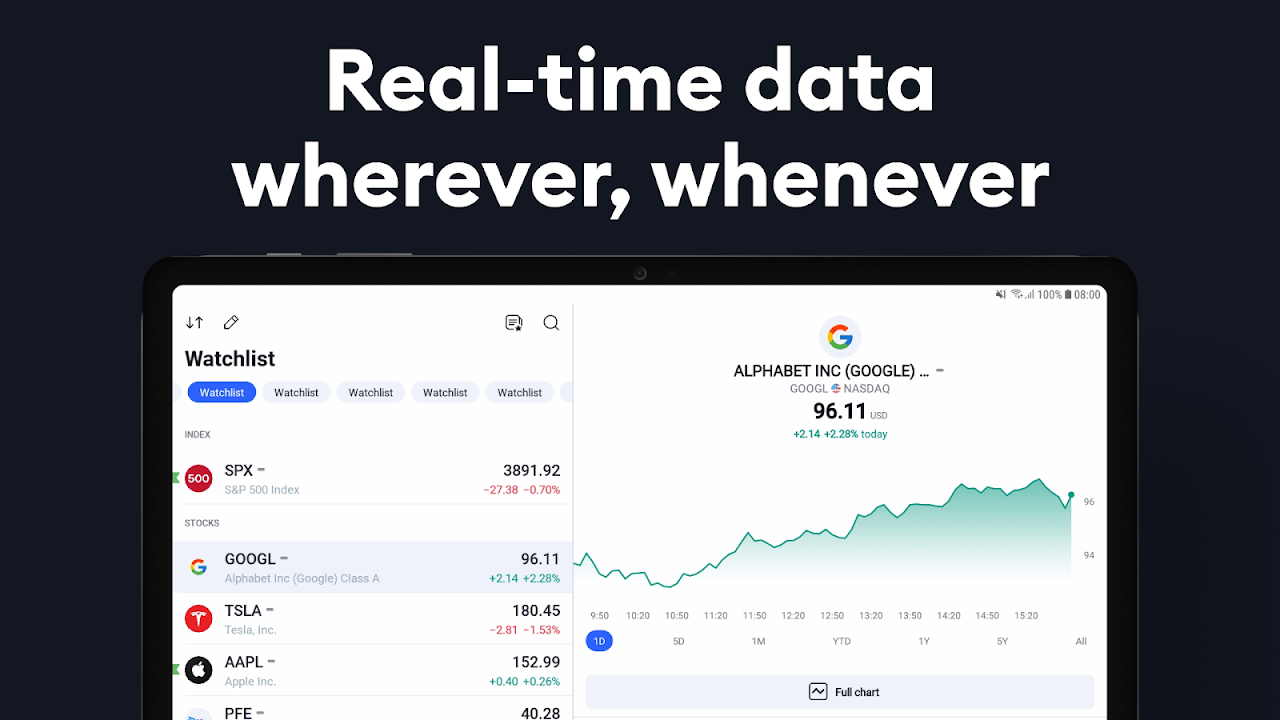
Simple for beginners and effective for technical analysis experts, TradingView has all of the instruments for publication and the viewing of trading ideas. Real-time quotes and charts are available for wherever you are at whatever time.
At TradingView, all data is obtained by professional providers who have direct and extensive access to stock quotes, futures, popular indices, Forex, Bitcoin and CFDs.
You can effectively track stock market and major global indices such as the NASDAQ Composite, S&P 500 (SPX), NYSE, Dow Jones (DJI), DAX, FTSE 100, NIKKEI 225, etc. You can also learn more about exchange rates, oil prices, mutual funds, bonds, ETFs and other commodities.
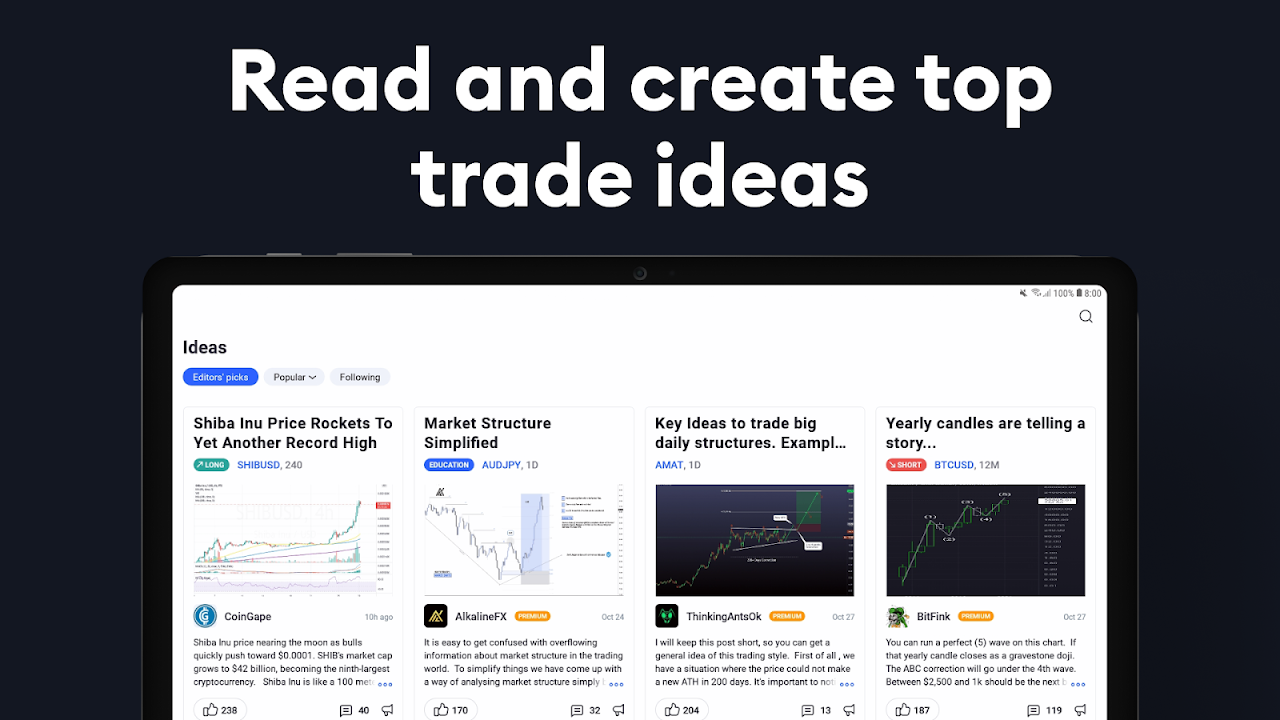
TradingView is the most active social network for traders and investors. Connect with millions of traders from around the world, learn from the experiences of other investors and discuss trading ideas.
Advanced Charts
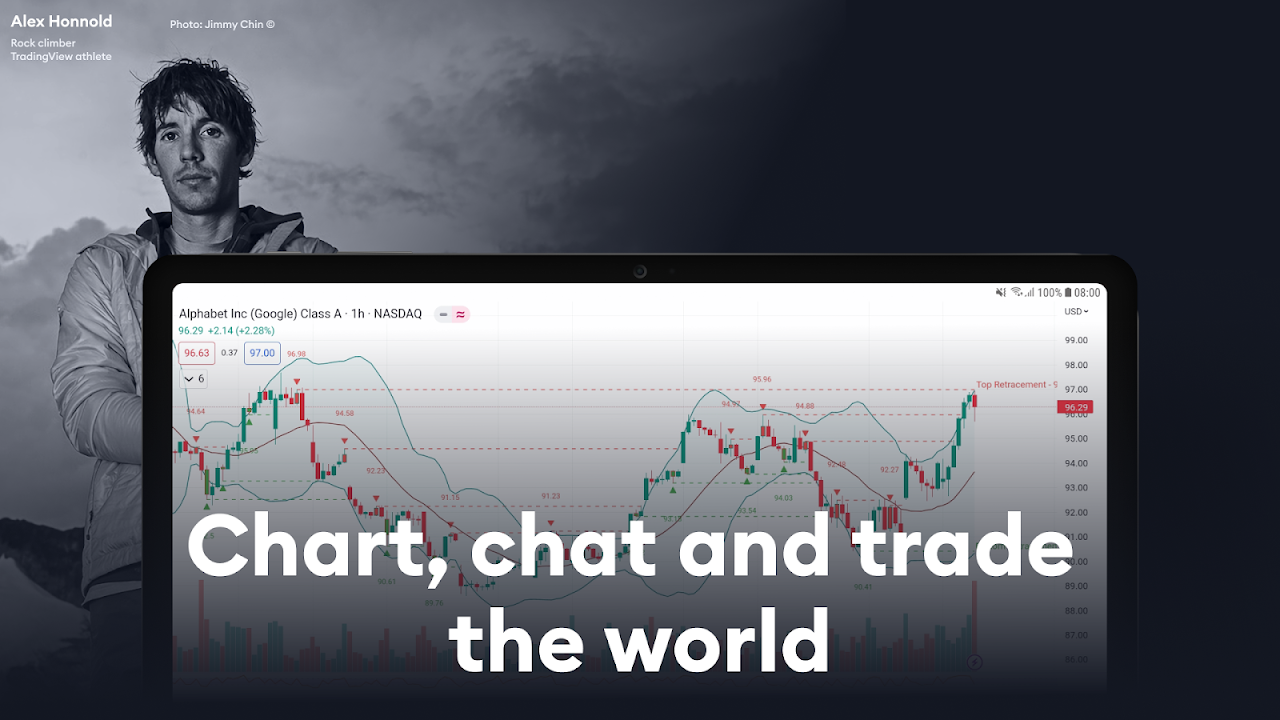
TradingView has excellent charts that surpass even desktop trading platforms in quality.
No compromises. All of the features, settings and tools of our charts will also be available in our app version. Over 10 types of charts for market analysis from different angles. Starting with an elementary chart line and ending with Renko and Kagi charts, which focus heavily on price fluctuations and barely take time into account as a factor. They can be very useful for determining long-term trends and can help you earn money.
Choose from a large selection of price analysis tools, including, but not limited to, indicators, strategies, drawing objects (i.e. Gann, Elliot Wave, moving averages) and more.
Individual watchlists and alerts
You can track major global indices, stocks, currency pairs, bonds, futures, mutual funds, commodities and cryptocurrencies all in real-time.
Alerts will help you not to miss the smallest of changes in the market and will allow you to react in time to invest or sell profitably, increasing your overall profit.
Flexible settings help you to track the indices you need and also group them in a way that is convenient for you.
Syncing your accounts
All saved changes, notifications, charts, and technical analysis, which you began on the TradingView platform will be automatically accessible from your mobile device through the app.
Real-time data from global exchanges
Gain access to data in real-time on more than 100,000 instruments from over 50 exchanges from the United States, the East, and countries in Asia and Europe, such as: NYSE, LSE, TSE, SSE, HKEx, Euronext, TSX, SZSE, FWB, SIX, ASX, KRX, NASDAQ, JSE, Bolsa de Madrid, TWSE, BM&F/B3 and many others!
Commodity prices
In real-time, you can track prices for gold, silver, oil, natural gas, cotton, sugar, wheat, corn, and many other products.
Global indices
Track major indices of the world stock market in real-time:
■ North and South America: Dow Jones, S&P 500, NYSE, NASDAQ Composite, SmallCap 2000, NASDAQ 100, Merval, Bovespa, RUSSELL 2000, IPC, IPSA;
■ Europe: CAC 40, FTSE MIB, IBEX 35, ATX, BEL 20, DAX, BSE Sofia, PX, РТС;
■ Asian-Pacific Ocean Regions: NIKKEI 225, SENSEX, NIFTY, SHANGHAI COMPOSITE, S&P/ASX 200, HANG SENG, KOSPI, KLCI, NZSE 50;
■ Africa: Kenya NSE 20, Semdex, Moroccan All Shares, South Africa 40; and
■ Middle East: EGX 30, Amman SE General, Kuwait Main, TA 25.
Cryptocurrency
Get the opportunity to compare prices from leading cryptocurrency exchanges.
TradingView is a versatile and feature-rich charting platform designed to empower traders with advanced technical analysis tools and real-time market data. It offers a comprehensive suite of functionalities that cater to the needs of both novice and experienced traders alike.
User-Friendly Interface
TradingView boasts a user-friendly interface that makes it accessible to traders of all skill levels. The intuitive design allows users to navigate seamlessly through the platform and quickly access the features they need. Customizable workspaces enable traders to personalize their trading environment and arrange charts and indicators according to their preferences.
Advanced Charting Capabilities
At the core of TradingView lies its advanced charting capabilities. Traders can choose from a wide range of chart types, including line, bar, candlestick, and Heikin Ashi, to visualize market data. Multiple timeframes can be displayed simultaneously, allowing traders to analyze trends at different scales. Drawing tools and annotations enable traders to mark important price levels, identify patterns, and share their insights with others.
Technical Indicators and Strategies
TradingView offers an extensive library of technical indicators and trading strategies that can be applied to charts. These indicators help traders identify trends, assess momentum, and predict future price movements. Traders can also create and save their own custom indicators and strategies, allowing them to tailor the platform to their specific trading style.
Real-Time Market Data
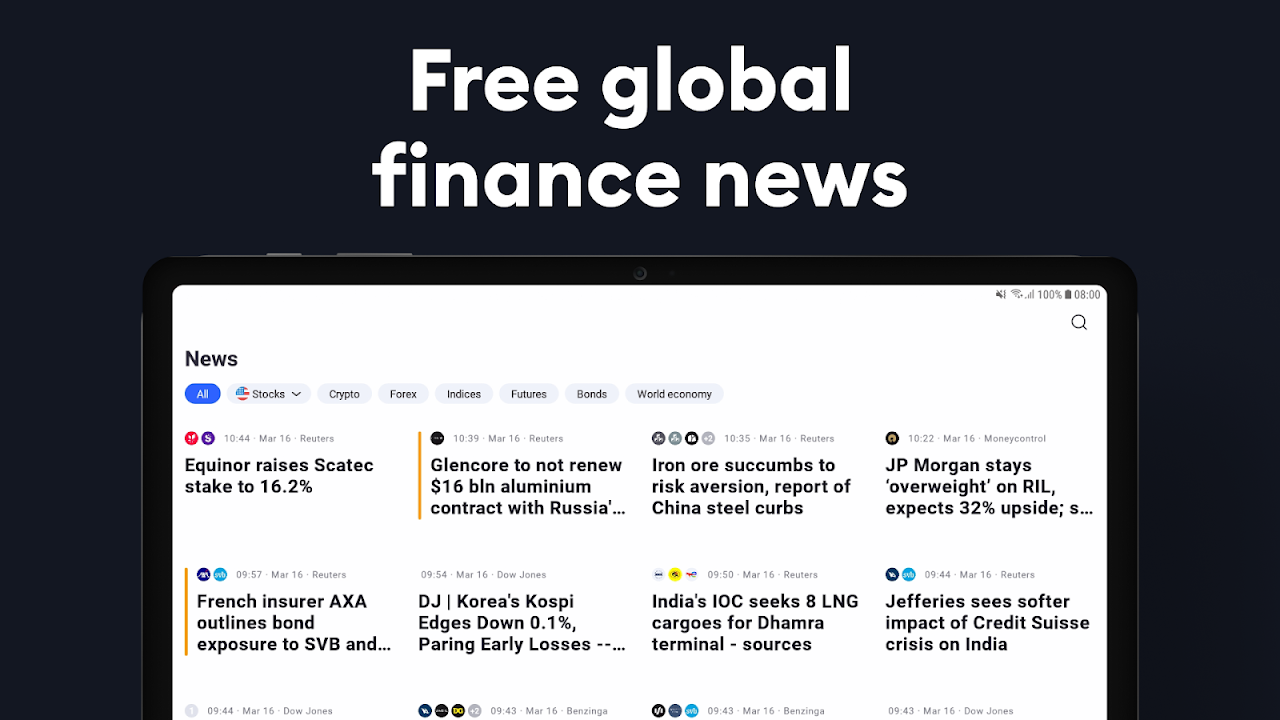
TradingView provides real-time market data for a wide range of financial instruments, including stocks, indices, commodities, and cryptocurrencies. Traders can monitor price movements, track market depth, and receive real-time alerts on price changes. The platform also offers economic news and events, keeping traders informed about market-moving events.
Community and Collaboration
TradingView fosters a vibrant community of traders who share ideas, insights, and strategies. The platform features a social media-like feed where traders can post their analysis, ask questions, and engage with other members. Traders can also collaborate on ideas and develop trading strategies together.
Additional Features
In addition to its core functionalities, TradingView offers a range of additional features to enhance the trading experience. These include:
* Paper trading: Traders can practice their strategies and test new ideas in a risk-free environment.
* Pine Script: A custom programming language that allows traders to create and automate their own indicators and strategies.
* Backtesting: Traders can evaluate the performance of their strategies on historical data.
* Mobile apps: TradingView offers mobile apps for iOS and Android devices, providing traders with access to their charts and data on the go.
Pricing and Plans
TradingView offers a tiered pricing structure with three plans: Basic, Pro, and Premium. The Basic plan is free to use and includes limited features. The Pro plan offers more advanced features, including custom indicators, unlimited charts, and extended history. The Premium plan provides access to real-time market data, backtesting, and paper trading.
Conclusion
TradingView is a comprehensive and versatile charting platform that empowers traders with advanced technical analysis tools, real-time market data, and a vibrant community. Its user-friendly interface, extensive charting capabilities, and social features make it an ideal choice for traders of all levels. Whether you are a novice looking to learn the basics of technical analysis or an experienced trader seeking advanced tools, TradingView has something to offer.
Simple for beginners and effective for technical analysis experts, TradingView has all of the instruments for publication and the viewing of trading ideas. Real-time quotes and charts are available for wherever you are at whatever time.
At TradingView, all data is obtained by professional providers who have direct and extensive access to stock quotes, futures, popular indices, Forex, Bitcoin and CFDs.
You can effectively track stock market and major global indices such as the NASDAQ Composite, S&P 500 (SPX), NYSE, Dow Jones (DJI), DAX, FTSE 100, NIKKEI 225, etc. You can also learn more about exchange rates, oil prices, mutual funds, bonds, ETFs and other commodities.
TradingView is the most active social network for traders and investors. Connect with millions of traders from around the world, learn from the experiences of other investors and discuss trading ideas.
Advanced Charts
TradingView has excellent charts that surpass even desktop trading platforms in quality.
No compromises. All of the features, settings and tools of our charts will also be available in our app version. Over 10 types of charts for market analysis from different angles. Starting with an elementary chart line and ending with Renko and Kagi charts, which focus heavily on price fluctuations and barely take time into account as a factor. They can be very useful for determining long-term trends and can help you earn money.
Choose from a large selection of price analysis tools, including, but not limited to, indicators, strategies, drawing objects (i.e. Gann, Elliot Wave, moving averages) and more.
Individual watchlists and alerts
You can track major global indices, stocks, currency pairs, bonds, futures, mutual funds, commodities and cryptocurrencies all in real-time.
Alerts will help you not to miss the smallest of changes in the market and will allow you to react in time to invest or sell profitably, increasing your overall profit.
Flexible settings help you to track the indices you need and also group them in a way that is convenient for you.
Syncing your accounts
All saved changes, notifications, charts, and technical analysis, which you began on the TradingView platform will be automatically accessible from your mobile device through the app.
Real-time data from global exchanges
Gain access to data in real-time on more than 100,000 instruments from over 50 exchanges from the United States, the East, and countries in Asia and Europe, such as: NYSE, LSE, TSE, SSE, HKEx, Euronext, TSX, SZSE, FWB, SIX, ASX, KRX, NASDAQ, JSE, Bolsa de Madrid, TWSE, BM&F/B3 and many others!
Commodity prices
In real-time, you can track prices for gold, silver, oil, natural gas, cotton, sugar, wheat, corn, and many other products.
Global indices
Track major indices of the world stock market in real-time:
■ North and South America: Dow Jones, S&P 500, NYSE, NASDAQ Composite, SmallCap 2000, NASDAQ 100, Merval, Bovespa, RUSSELL 2000, IPC, IPSA;
■ Europe: CAC 40, FTSE MIB, IBEX 35, ATX, BEL 20, DAX, BSE Sofia, PX, РТС;
■ Asian-Pacific Ocean Regions: NIKKEI 225, SENSEX, NIFTY, SHANGHAI COMPOSITE, S&P/ASX 200, HANG SENG, KOSPI, KLCI, NZSE 50;
■ Africa: Kenya NSE 20, Semdex, Moroccan All Shares, South Africa 40; and
■ Middle East: EGX 30, Amman SE General, Kuwait Main, TA 25.
Cryptocurrency
Get the opportunity to compare prices from leading cryptocurrency exchanges.
TradingView is a versatile and feature-rich charting platform designed to empower traders with advanced technical analysis tools and real-time market data. It offers a comprehensive suite of functionalities that cater to the needs of both novice and experienced traders alike.
User-Friendly Interface
TradingView boasts a user-friendly interface that makes it accessible to traders of all skill levels. The intuitive design allows users to navigate seamlessly through the platform and quickly access the features they need. Customizable workspaces enable traders to personalize their trading environment and arrange charts and indicators according to their preferences.
Advanced Charting Capabilities
At the core of TradingView lies its advanced charting capabilities. Traders can choose from a wide range of chart types, including line, bar, candlestick, and Heikin Ashi, to visualize market data. Multiple timeframes can be displayed simultaneously, allowing traders to analyze trends at different scales. Drawing tools and annotations enable traders to mark important price levels, identify patterns, and share their insights with others.
Technical Indicators and Strategies
TradingView offers an extensive library of technical indicators and trading strategies that can be applied to charts. These indicators help traders identify trends, assess momentum, and predict future price movements. Traders can also create and save their own custom indicators and strategies, allowing them to tailor the platform to their specific trading style.
Real-Time Market Data
TradingView provides real-time market data for a wide range of financial instruments, including stocks, indices, commodities, and cryptocurrencies. Traders can monitor price movements, track market depth, and receive real-time alerts on price changes. The platform also offers economic news and events, keeping traders informed about market-moving events.
Community and Collaboration
TradingView fosters a vibrant community of traders who share ideas, insights, and strategies. The platform features a social media-like feed where traders can post their analysis, ask questions, and engage with other members. Traders can also collaborate on ideas and develop trading strategies together.
Additional Features
In addition to its core functionalities, TradingView offers a range of additional features to enhance the trading experience. These include:
* Paper trading: Traders can practice their strategies and test new ideas in a risk-free environment.
* Pine Script: A custom programming language that allows traders to create and automate their own indicators and strategies.
* Backtesting: Traders can evaluate the performance of their strategies on historical data.
* Mobile apps: TradingView offers mobile apps for iOS and Android devices, providing traders with access to their charts and data on the go.
Pricing and Plans
TradingView offers a tiered pricing structure with three plans: Basic, Pro, and Premium. The Basic plan is free to use and includes limited features. The Pro plan offers more advanced features, including custom indicators, unlimited charts, and extended history. The Premium plan provides access to real-time market data, backtesting, and paper trading.
Conclusion
TradingView is a comprehensive and versatile charting platform that empowers traders with advanced technical analysis tools, real-time market data, and a vibrant community. Its user-friendly interface, extensive charting capabilities, and social features make it an ideal choice for traders of all levels. Whether you are a novice looking to learn the basics of technical analysis or an experienced trader seeking advanced tools, TradingView has something to offer.