


Gantt chart for your project management.
Create gantt chart(WBS) quickly for your project management.
It is helpful through planning to operation as ToDo list and Memo pad are attached.
Function:
- Create gantt chart with tasks, sub tasks and milestones.
- Draw links which shows the dependency between tasks.
- View the summary table for tasks and links.
- Project files can be shared on the cloud.
- Memo pad and Todo list.
- Create PDF file
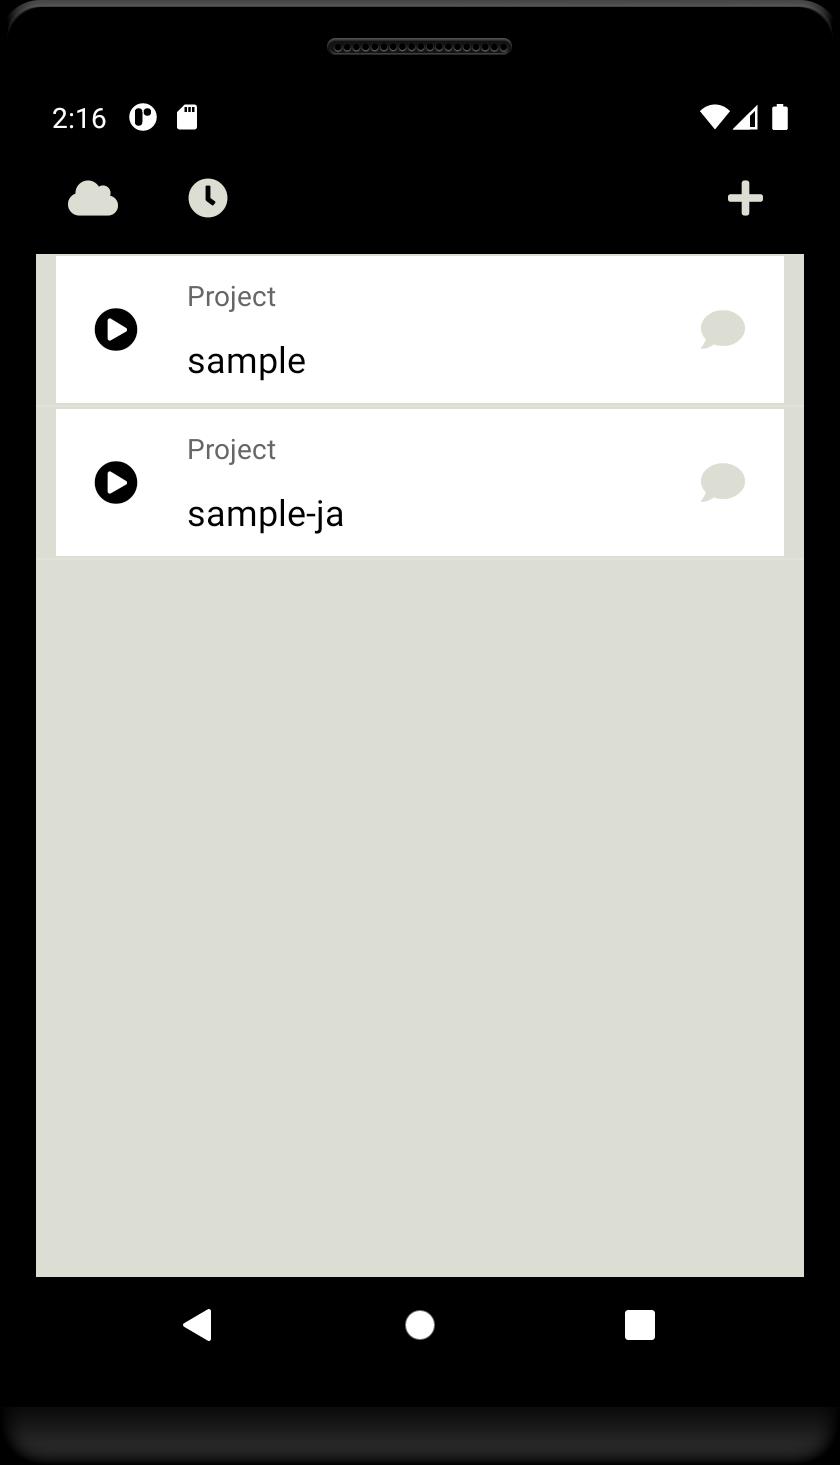
Project View:
- Top page of this app.
- Open task view by tapping the project.
- Open editing menu by long tapping the project.
- Plus button shows the dialog to create new project.
- Cloud button shows the menus for sharing the project on the cloud.
- Timer button shows the dialog to set the push notification.
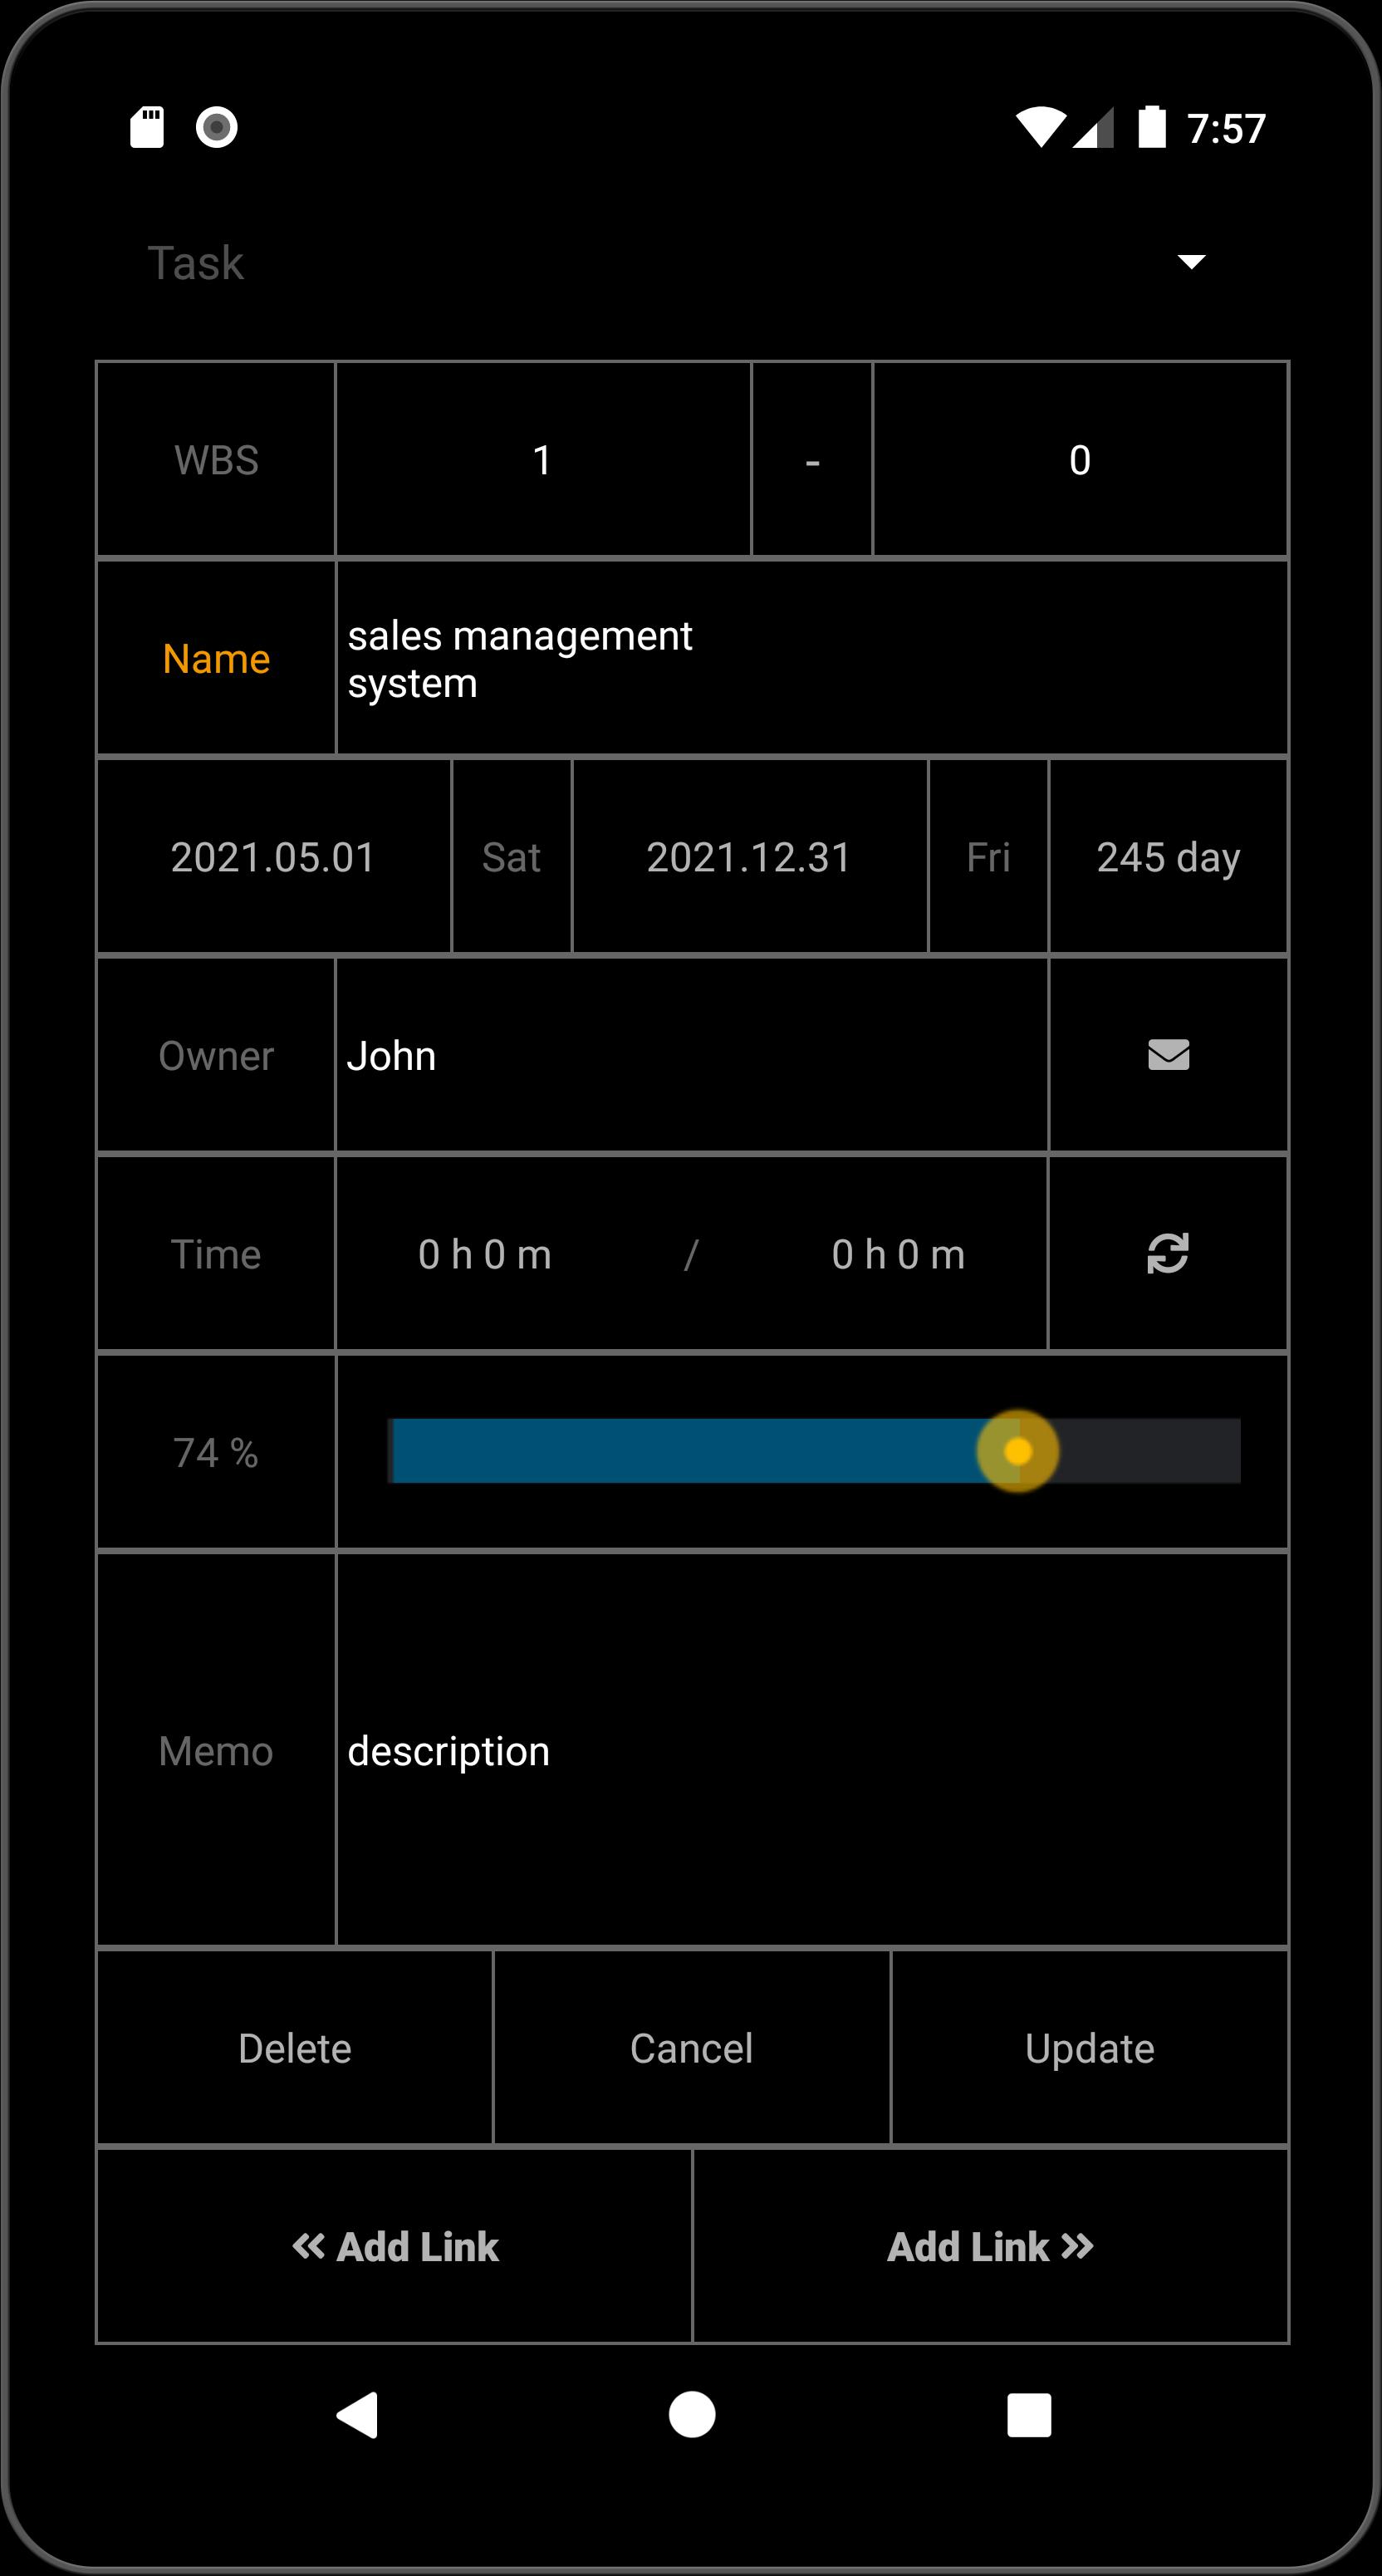
Task View:
- List the tasks.
- Task type is task, sub-task or milestone.
- Open task editor by tapping the task.
- Tasks can be filtered by date, progress and person.
- Auto Sync of the progress is available.
- Save button allows for save, save-as or upload to the cloud.
- Arrow button shows the gantt chart.
Link View:
- List the links.
- Invalid link is shown in red color.
- Open link editor by tapping the link.
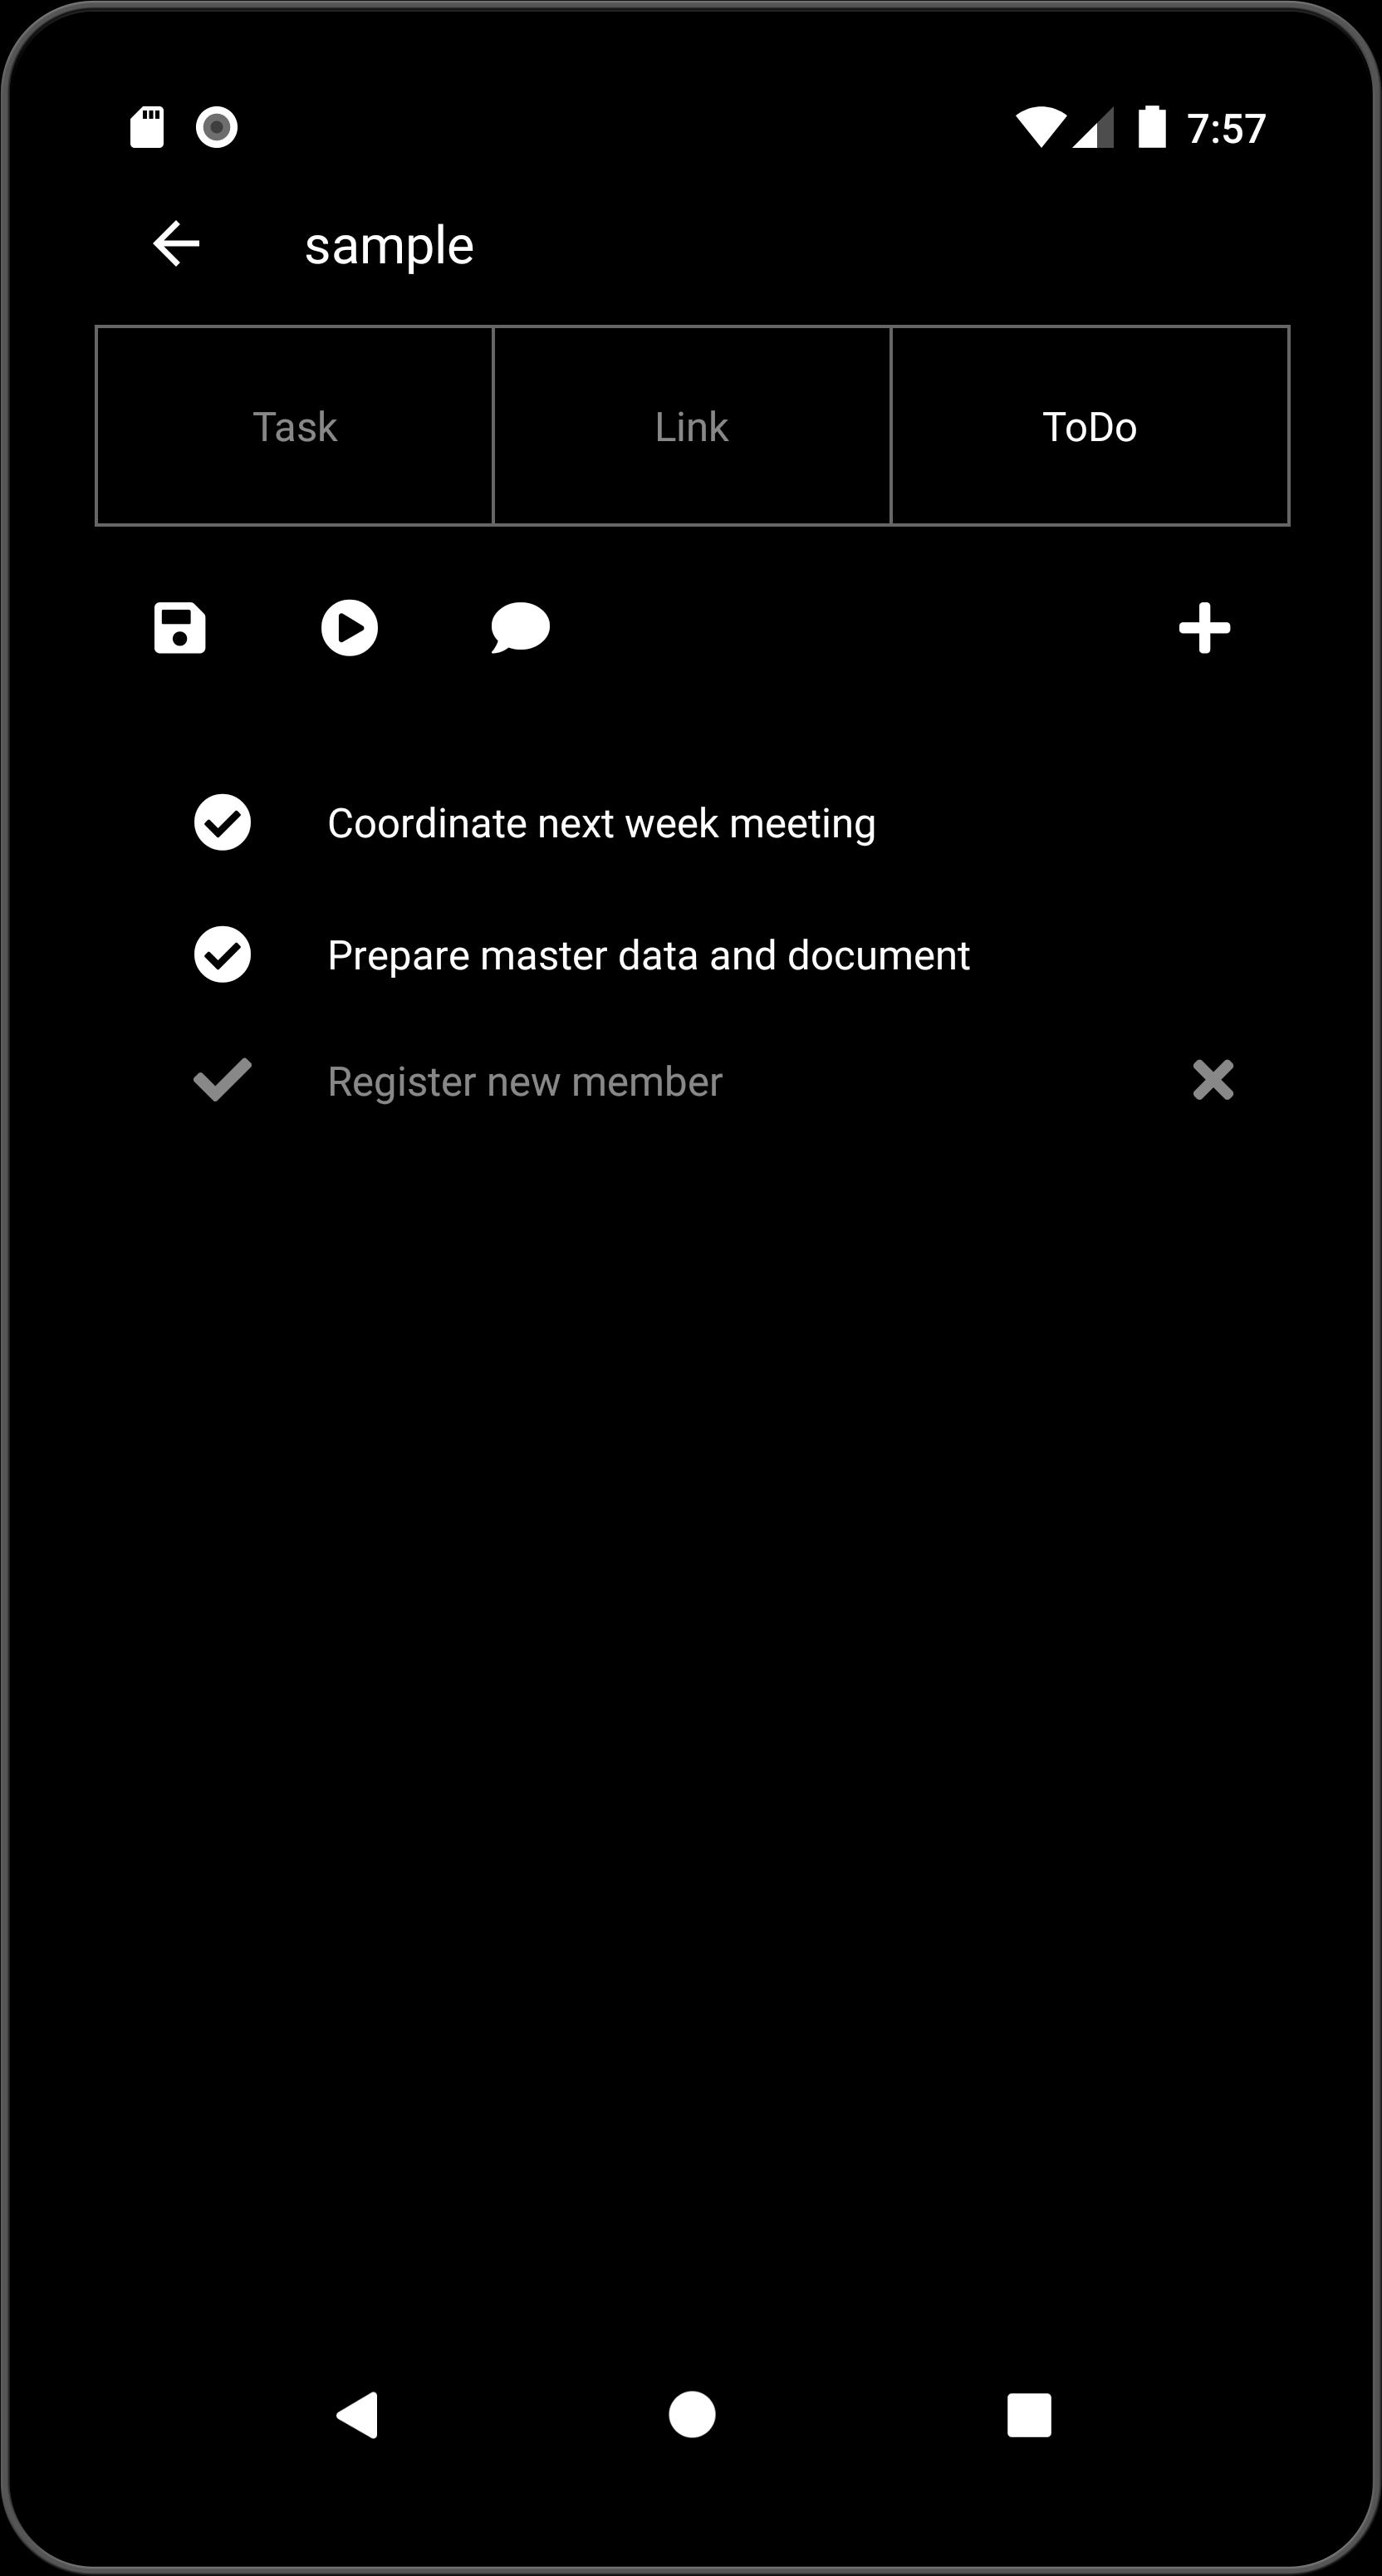
Todo View:
- List the Todo.
- Open the editor by tapping the item.
- Switch the status by tapping the check mark.
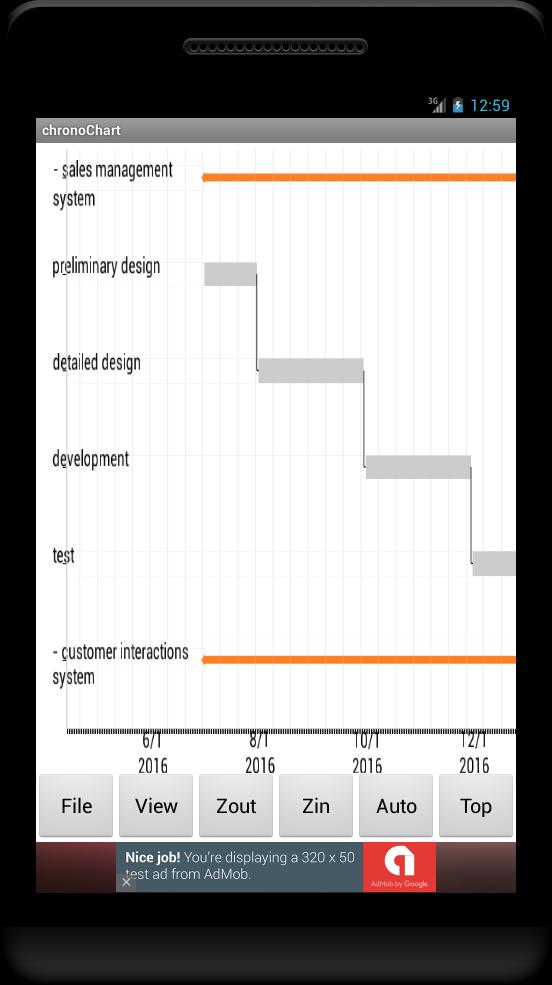
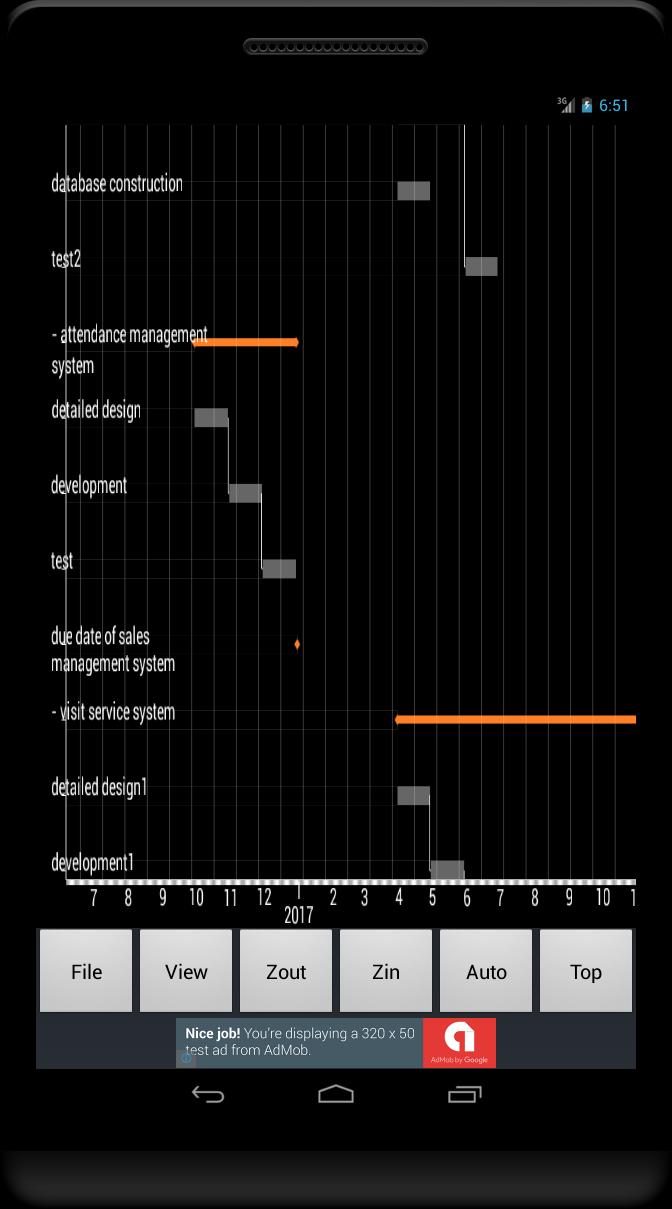
Gantt Chart:
- Move by swiping.
- Zoom in/out button.
- Sub tasks can be fold by tapping the plus mark at left side of the task.
- Task editor opens by tapping the chart.
- Link editor opens by long tapping the chart.
Cloud Service:
- You can share the project with the other users on the cloud.
- Registration is required to accessing the cloud.
Note:
- No advertisement if you pay for the Premium item.
- This app uses the Apache 2.0 license library - AChartEngine.
(http://www.apache.org/licenses/LICENSE-2.0)
What's New in the Latest Version 10.5
Last updated on Jul 15, 2024
(2024.7.14)
- API maintenance
(2023.12.16)
- library update.
Overview
A Gantt chart is a graphical representation of a project's schedule that visually displays the start and end dates of tasks and their dependencies. It is named after Henry Gantt, an American engineer and management consultant who developed the chart in the early 1900s.
Structure
A Gantt chart consists of two main components:
* Timeline: The horizontal axis of the chart represents the project timeline, typically divided into days, weeks, or months.
* Tasks: Each task in the project is represented by a horizontal bar on the chart. The length of the bar indicates the duration of the task.
Dependencies
Dependencies between tasks are indicated by arrows or lines connecting the bars. These dependencies represent the logical relationships between tasks, such as:
* Finish-to-Start: Task A must be completed before Task B can start.
* Start-to-Start: Task A and Task B must both start at the same time.
* Finish-to-Finish: Task A and Task B must both finish at the same time.
Critical Path
The critical path is the sequence of tasks that determines the shortest possible project duration. Any delay in a task on the critical path will delay the entire project. The critical path is often highlighted in a Gantt chart to emphasize its importance.
Benefits
Gantt charts provide numerous benefits for project management, including:
* Visual representation: The graphical nature of Gantt charts makes it easy to visualize the project schedule and identify potential bottlenecks.
* Task sequencing: Gantt charts help ensure that tasks are sequenced in a logical and efficient order.
* Progress tracking: Gantt charts can be used to track project progress and identify areas that may be behind schedule.
* Resource allocation: Gantt charts can be used to allocate resources to tasks and ensure that they are used efficiently.
* Communication: Gantt charts provide a common reference point for project stakeholders to communicate and coordinate their efforts.
Limitations
While Gantt charts are a valuable tool for project management, they also have some limitations:
* Complexity: Gantt charts can become complex for large or complex projects, making them difficult to interpret and manage.
* Static nature: Gantt charts are static representations of a project schedule, which may not reflect changes that occur during the project lifecycle.
* Lack of flexibility: Gantt charts are less flexible than other scheduling tools, such as network diagrams, which can accommodate changes more easily.
Conclusion
Gantt charts are a powerful tool for project scheduling and management. They provide a visual representation of a project's schedule, help identify dependencies between tasks, and track project progress. However, they also have limitations, such as complexity and static nature. By understanding the benefits and limitations of Gantt charts, project managers can effectively utilize them to plan, execute, and monitor their projects.
Gantt chart for your project management.
Create gantt chart(WBS) quickly for your project management.
It is helpful through planning to operation as ToDo list and Memo pad are attached.
Function:
- Create gantt chart with tasks, sub tasks and milestones.
- Draw links which shows the dependency between tasks.
- View the summary table for tasks and links.
- Project files can be shared on the cloud.
- Memo pad and Todo list.
- Create PDF file
Project View:
- Top page of this app.
- Open task view by tapping the project.
- Open editing menu by long tapping the project.
- Plus button shows the dialog to create new project.
- Cloud button shows the menus for sharing the project on the cloud.
- Timer button shows the dialog to set the push notification.
Task View:
- List the tasks.
- Task type is task, sub-task or milestone.
- Open task editor by tapping the task.
- Tasks can be filtered by date, progress and person.
- Auto Sync of the progress is available.
- Save button allows for save, save-as or upload to the cloud.
- Arrow button shows the gantt chart.
Link View:
- List the links.
- Invalid link is shown in red color.
- Open link editor by tapping the link.
Todo View:
- List the Todo.
- Open the editor by tapping the item.
- Switch the status by tapping the check mark.
Gantt Chart:
- Move by swiping.
- Zoom in/out button.
- Sub tasks can be fold by tapping the plus mark at left side of the task.
- Task editor opens by tapping the chart.
- Link editor opens by long tapping the chart.
Cloud Service:
- You can share the project with the other users on the cloud.
- Registration is required to accessing the cloud.
Note:
- No advertisement if you pay for the Premium item.
- This app uses the Apache 2.0 license library - AChartEngine.
(http://www.apache.org/licenses/LICENSE-2.0)
What's New in the Latest Version 10.5
Last updated on Jul 15, 2024
(2024.7.14)
- API maintenance
(2023.12.16)
- library update.
Overview
A Gantt chart is a graphical representation of a project's schedule that visually displays the start and end dates of tasks and their dependencies. It is named after Henry Gantt, an American engineer and management consultant who developed the chart in the early 1900s.
Structure
A Gantt chart consists of two main components:
* Timeline: The horizontal axis of the chart represents the project timeline, typically divided into days, weeks, or months.
* Tasks: Each task in the project is represented by a horizontal bar on the chart. The length of the bar indicates the duration of the task.
Dependencies
Dependencies between tasks are indicated by arrows or lines connecting the bars. These dependencies represent the logical relationships between tasks, such as:
* Finish-to-Start: Task A must be completed before Task B can start.
* Start-to-Start: Task A and Task B must both start at the same time.
* Finish-to-Finish: Task A and Task B must both finish at the same time.
Critical Path
The critical path is the sequence of tasks that determines the shortest possible project duration. Any delay in a task on the critical path will delay the entire project. The critical path is often highlighted in a Gantt chart to emphasize its importance.
Benefits
Gantt charts provide numerous benefits for project management, including:
* Visual representation: The graphical nature of Gantt charts makes it easy to visualize the project schedule and identify potential bottlenecks.
* Task sequencing: Gantt charts help ensure that tasks are sequenced in a logical and efficient order.
* Progress tracking: Gantt charts can be used to track project progress and identify areas that may be behind schedule.
* Resource allocation: Gantt charts can be used to allocate resources to tasks and ensure that they are used efficiently.
* Communication: Gantt charts provide a common reference point for project stakeholders to communicate and coordinate their efforts.
Limitations
While Gantt charts are a valuable tool for project management, they also have some limitations:
* Complexity: Gantt charts can become complex for large or complex projects, making them difficult to interpret and manage.
* Static nature: Gantt charts are static representations of a project schedule, which may not reflect changes that occur during the project lifecycle.
* Lack of flexibility: Gantt charts are less flexible than other scheduling tools, such as network diagrams, which can accommodate changes more easily.
Conclusion
Gantt charts are a powerful tool for project scheduling and management. They provide a visual representation of a project's schedule, help identify dependencies between tasks, and track project progress. However, they also have limitations, such as complexity and static nature. By understanding the benefits and limitations of Gantt charts, project managers can effectively utilize them to plan, execute, and monitor their projects.